Click here for Part II and here for Part I
Why in news?
The Union Minister for Finance and Corporate Affairs, Ms. Nirmala Sitharaman tabled the Economic Survey 2018-19 in the Parliament.
What are the key highlights?
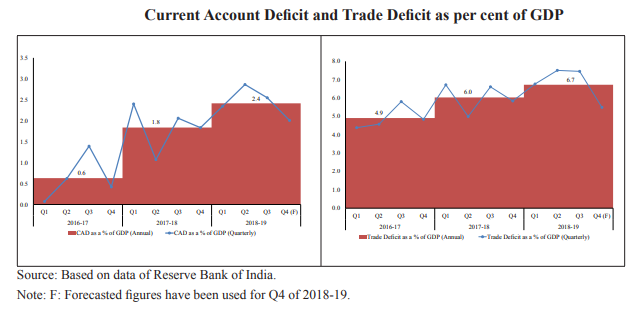
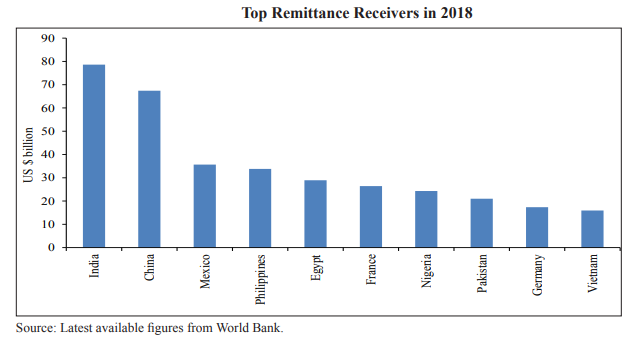
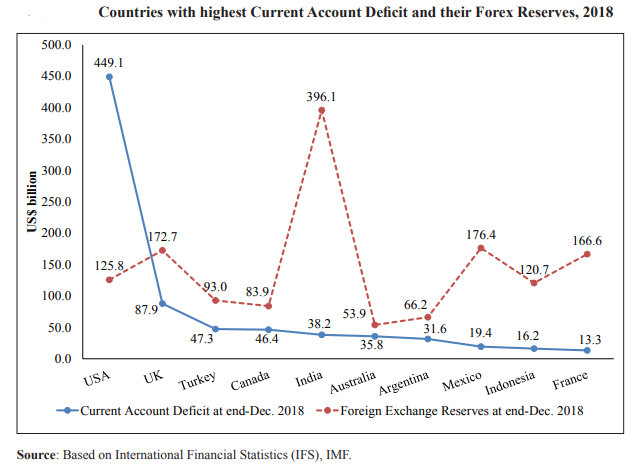
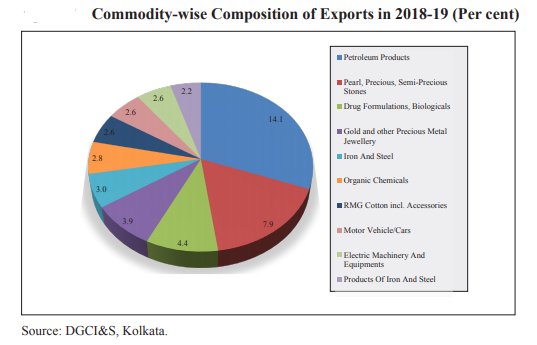
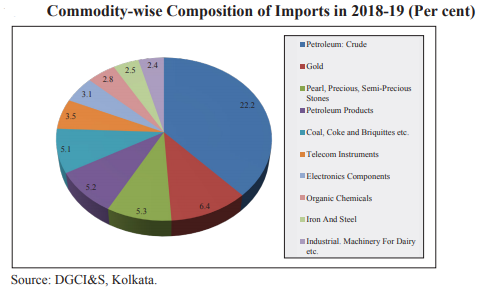
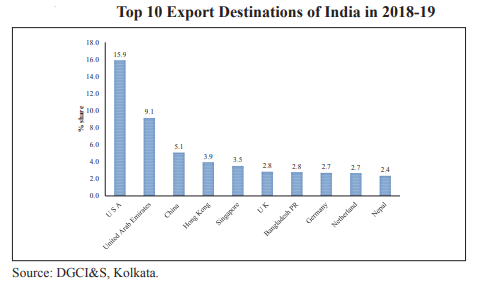
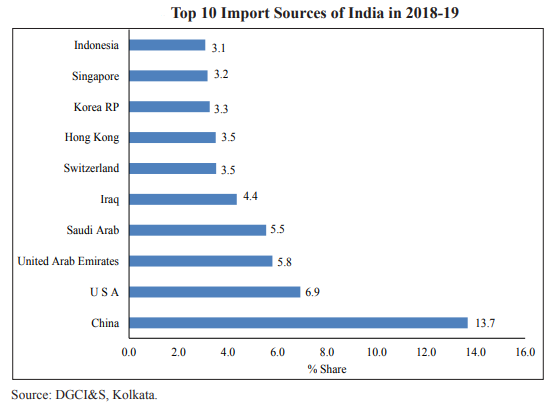
EXTERNAL SECTOR
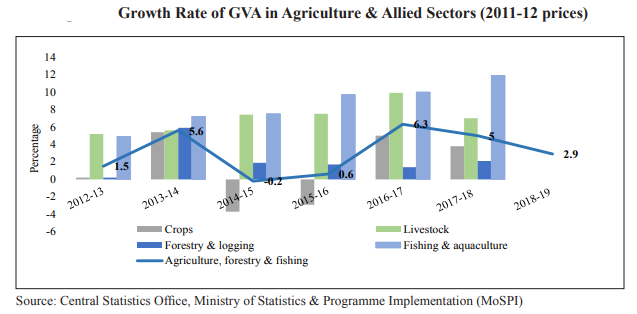
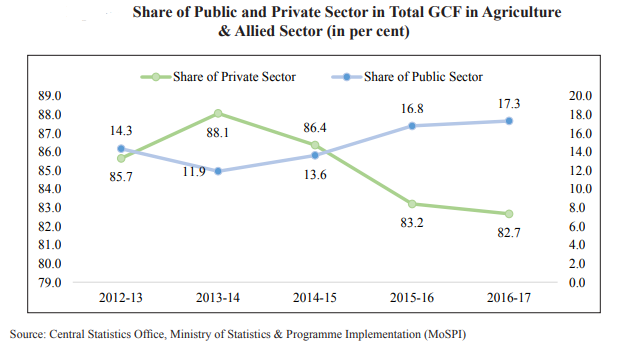
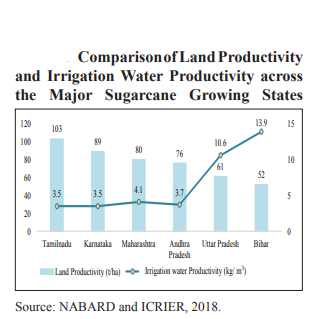
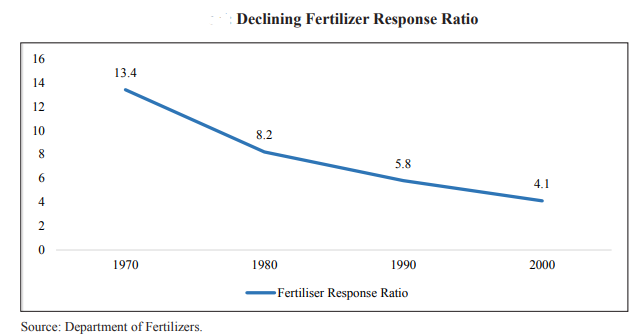
AGRICULTURE AND FOOD MANAGEMENT
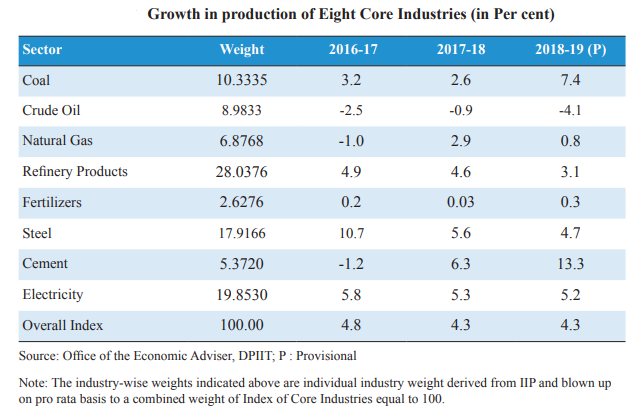
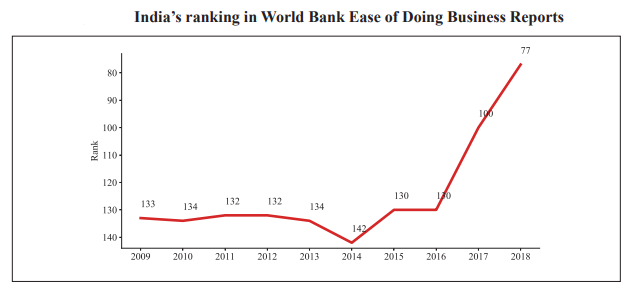
INDUSTRY
INFRASTRUCTURE
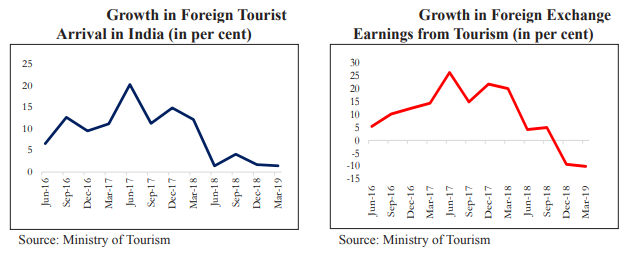
SERVICES SECTOR
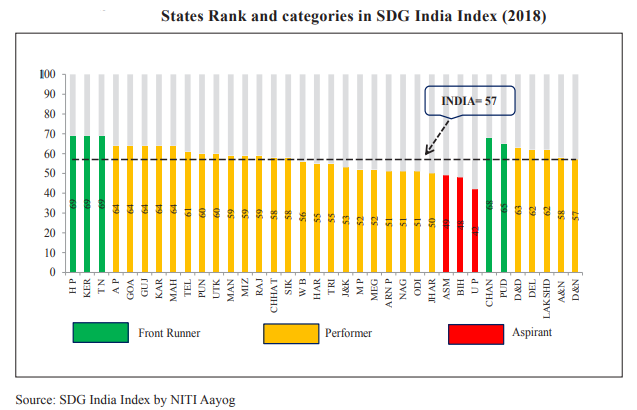
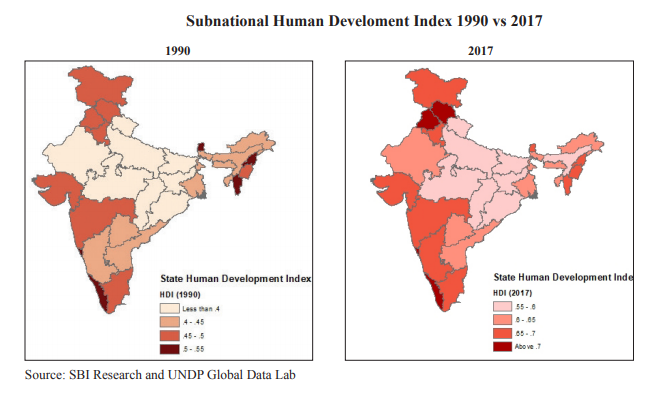
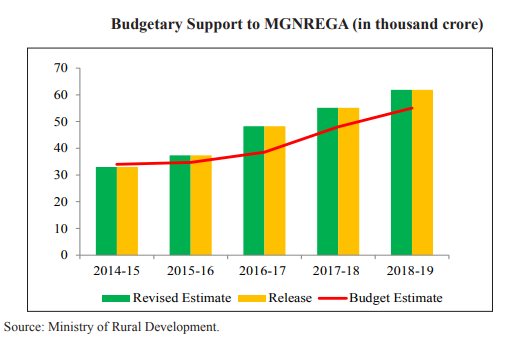
SOCIAL INFRASTRUCTURE, EMPLOYMENT AND HUMAN DEVELOPMENT
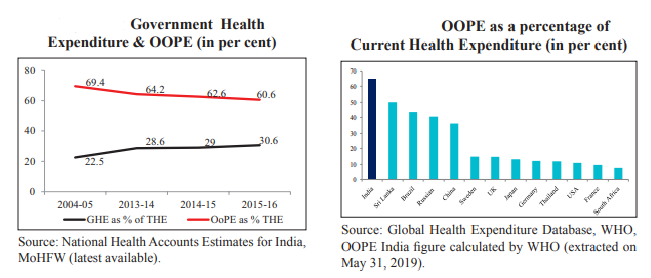
Note: OOPE - Out of Pocket Expenditure; THE - Total Health Expenditure
Source: Ministry of Finance Website