0.1602
900 319 0030
x

The Inclusive Growth and Development Report 2017

iasparliament Logo
July 24, 2017

What is the purpose of the report?

  • It is computed by World Economic Forum to provide a more complete measure of economic development.
  • This Report seeks to help international community to practice inclusive growth and development.
  • Itoffers a new policy framework and a set of indicators for this purpose.
  • They help to diffuse widely the benefits of an expanding national economy in terms of household income, opportunity, economic security, and quality of life.
  • The policy framework has seven principal pillars and 15 sub-pillars.

  • A systematic, sustained effort to strengthen institutions and policy incentives across the Framework’s 15 sub-domains, boosts broad living standards while reinforcing the rate and resilience of growth.

What are the present challenges in the world economy?

  • Fall in long-term growth
  • Limited Investments

  • Near zero interest rate
  • Unfavourable demographic trend in many countries
  • In-country inequalities

  • Rising unemployment due to automation
  • Limitation of GDP as Metric

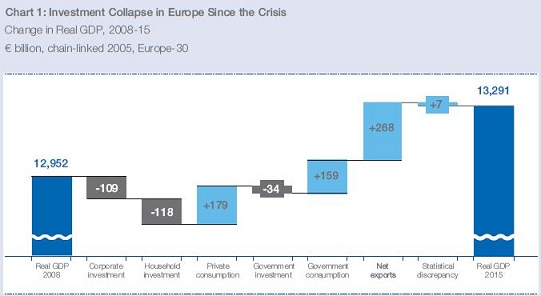
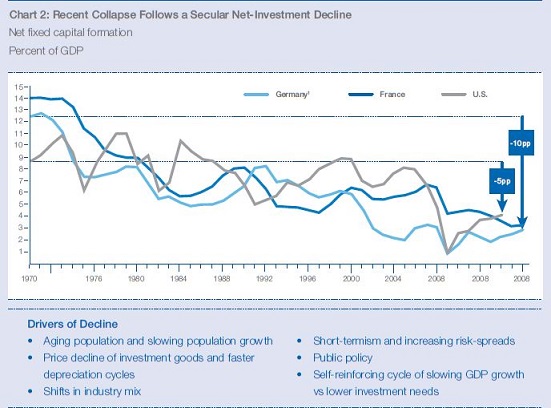
Why GDP is not enough to reflect these?

  • The concept of GDP was always intended as a measure of economic activity exclusively.
  • But it has frequently been used as a proxy for well-being.
  • The limitations of GDP in this regard are
  • Using it as a measure of output - GDP no longer provides an adequate measure of economic activity.
  • It uses single monetary value.
  • The figure does not properly reflect the complexity of the modern economy.
  • GDP also does not capture the full extent of the digital, globalized economy
  • Companies operate across borders in a way that makes it difficult to allocate value added accurately.
  • It also fails to measure the quality of goods and the fruits of innovation that lead to improvements in goods or services, which is important in measuring change in real income and consumption.
  • Using it as a measure of social and economic progress – It is unable to explain the distribution of growth (whether for income, consumption, health, education, or any other factor).
  • This means that using GDP as a measure of prosperity will fail to account for who is getting richer and its consequences.
  • GDP does not measure the overall standard of living or well-being of a country, concepts which are multidimensional and not solely based on economic factors.
  • These include dimensions such as health, education, and employment, which are not adequately captured in a measure like GDP.
  • Intergenerational equity, which refers to whether economic performance is being pursued at the expense of future generations, is another limitation of GDP.
  • Increasing output, which at first glance would be “good” for GDP, may come at the expense of externalities such as environmental damage, reduced leisure time, or the depletion of natural resources.
  • There is no link between GDP and the sustainability of the economy.

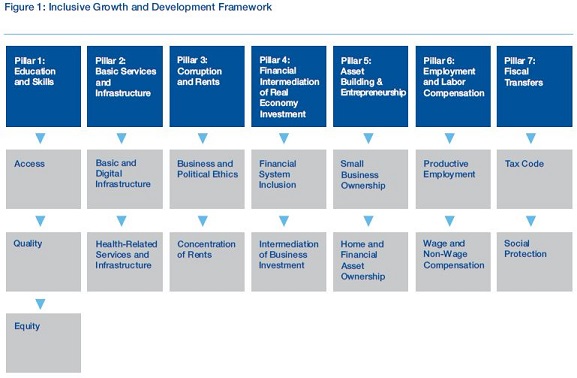
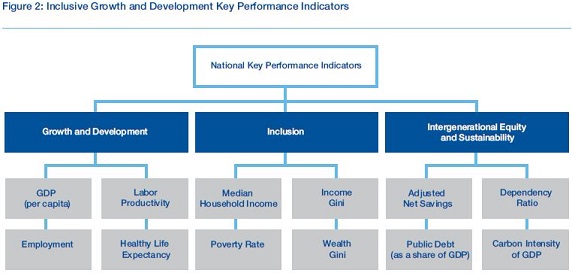
What are the indices offered?

  • The report contains a cross-country database of indicators called Policy and Institutional Indicators (PIIs), that enables comparison at the pillar, sub-pillar, and individual indicator level for 109 countries.
  • This will help governments and stakeholders to assess their countries’ relative strengths and weaknesses.
  • Other set of indicators called National Key Performance Indicators (KPIs) provides a more complete picture of national economic performance, apart from just presenting the GDP.

  • Based on the combined KPI scores, a composite index is derived called the Inclusive Development Index (IDI).

What are the findings of the report?

  • Based on PIIs – The results are presented in four groups of countries based on their level of economic development as measured by national income.
  • They are Advanced Countries, Upper-Middle Income Countries, Lower-Middle Income Countries and Low Income Countries.

  • The following patterns emerge from this data
    1. Due to complexity of each country’s political economy, there is no single ideal policy mix for the pursuit of inclusive growth.
    2. Policies and institutions supporting social inclusion nare not solely a luxury of high-income countries. There is extensive overlap in absolute scores across at least three of the four income groups of countries in the sub-pillars.
    3. Larger fiscal transfers like offering social protections neither affect long-term growth nor is it enough to broaden socio-economic inclusion.
    4. A robust inclusive-growth strategy should be both pro-labor and pro-business.
  • Based on IDIs – IDI scores are based on the scale of 1-7 and it is computed separately for advanced and developing countries and is not comparable.
  1. General trend - Norway tops the list in advanced economies followed by Luxembourg and Switzerland.
  • Lithuania tops the list of 79 developing economies, Azerbaijan and Hungary at 2nd and 3rdpositions respectively.
  • Some countries score significantly better on the IDI than on the basis of GDP per capita.
  • This suggests they have done a relatively good job of making their growth processes more inclusive e.g Cambodia, the Czech Republic, New Zealand, South Korea, and Vietnam.
  • Other countries have significantly lower IDI rankings than GDP per capita rankings, indicating that their growth has not translated into social inclusion. e.g Brazil, Ireland, Japan, Mexico, Nigeria, South Africa, and the United States.
  • Of the 103 countries for which these data are available, 51% saw their IDI scores decline over the past five years.

  • This shows the challenge faced by policymakers in translating the economic growth into broad social progress.
  • 42% of the countries saw a decreasing IDI in spite of an increase in their GDP.
  • In over 75% of economies, wealth inequality rose 6.3% on average during this period.
  1. India - India’s growth in GDP per capita is among the top 10, strong labor productivity growth and lowering levels of poverty.
  • Yet, India only scored 3.38 and has been ranked 60th among the 79 developing economies.
  • It is much lower than the neighbouring countries. China (15th), Nepal (27th), Bangladesh (36th) and Pakistan (52nd).
  • One reason is due to its high debt-to-GDP ratio which raises questions about the sustainability of government spending.
  • Educational enrolment rates and the labor force participation rates are low.
  • The informal economy is large, and many workers are in vulnerable employment situations with little room for social mobility.
  • New business creation continues to be held back by corruption, underdeveloped infrastructure, and the large administrative burden involved in starting and running companies.

What are the recommendations?

  • Advanced countries - They experience diminishing returns from their monetary policy measures, have limited fiscal space, and unfavorable demographic trends (e.g., Japan, the United States, and the European Union, to various degrees).
  • For them a mixture of demand- and supply-side structural reforms could boost consumption and job creation in the short term.
  • For longer-term growth they should make improvements in labor productivity, household finances, real-economy investment, and innovation.
  • Middle-income countries – They experience weak exports and commodity prices, monetary policy constrained by the risk of currency depreciation and capital flight, and limited fiscal space e.g., Brazil, Russia, India, China, and South Africa.
  • They need a structural reform agenda of this nature is precisely what could rebalance their growth model toward more robust domestic consumption.
  • Lower-income countries – They experience extensive social marginalization due to poor resourcing of and inequitable access to basic services, education, and infrastructure as well as weak legal, tax, and investment climate institutions, a reform strategy with a sharper focus on these basic building blocks could help boost growth and social equity simultaneously.
  • To keep pace with the labor-market challenges due to Fourth Industrial Revolution countries should increase investments in -

1) Active labor-market policies

2) Equity of access to quality basic education

3) Gender parity

4) Non-standard work benefits and protections

5) Effective school-to-work transition

  • A universal basic income cannot be seen as a substitute for these measures. It might at best serve as a useful complement.
  • There should be a global effort for long-term inclusive development from OECD, ILO, WEF, World Bank etc. The G20 Enhanced Structural Reform Agenda, launched, provides an opening for such a coordinated international initiative.
  • International community – They should also fund a major increase in institution-building assistance for developing countries in the corresponding policy domains.
  • They should reform development finance institutions (DFIs) to support a scaling of blended, public-private financing of sustainable infrastructure
  • They should also reset the priorities of trade and investment cooperation to scale trade-related small-business activity and employment and reduce barriers to trade in services.
Login or Register to Post Comments
There are no reviews yet. Be the first one to review.

ARCHIVES

MONTH/YEARWISE ARCHIVES

Free UPSC Interview Guidance Programme